ThingsBoard - Watmonitor JSON integration
Today, we're excited to showcase the integration of the Watmonitor project (a smart level meter) with ThingsBoard – a powerful open-source IoT (Internet of Things) platform trusted by both hobbyists and enterprises for industrial and corporate applications.
ThingsBoard offers a wide range of features that can be used independently or combined in flexible ways to achieve the same goal. What makes it unique is that it operates as a Push-based platform, meaning it activates and processes functionality only when new data is received – whether through REST API or MQTT.
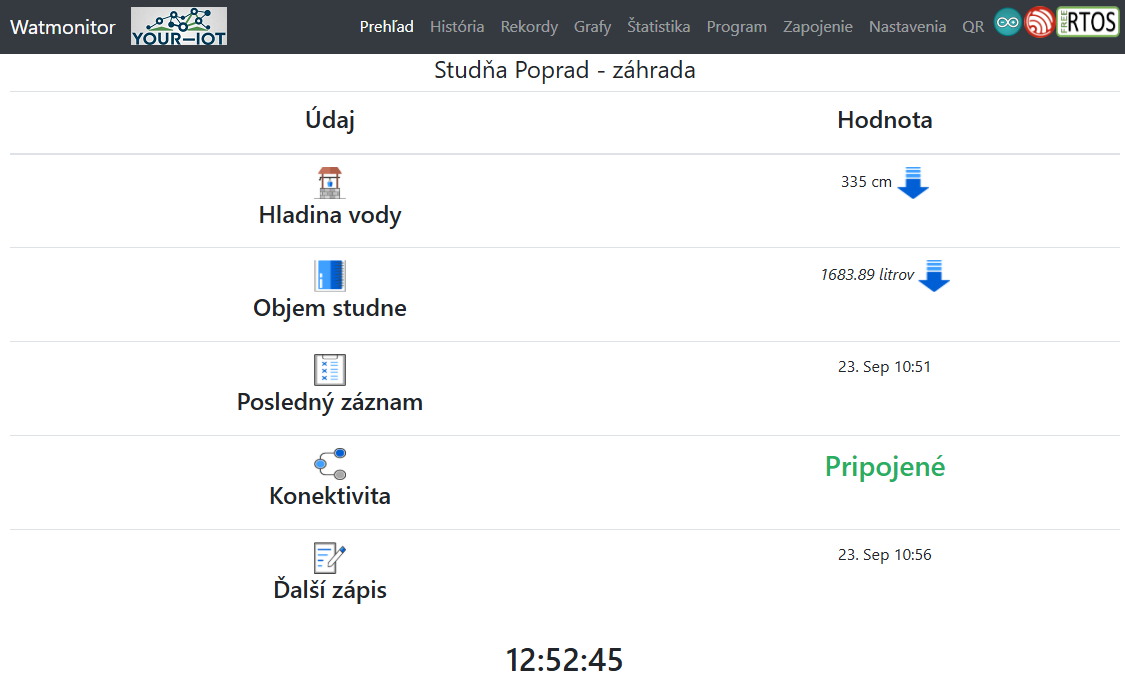
As highlighted in our previous article, Watmonitor (the web interface of the water level meter) provides two JSON endpoints for accessing system data. These endpoints can be called via the HTTP GET method:
-
json_output.php → delivers the most recent measurement.
-
json_output2.php → returns the full dataset from the database, which can be filtered using from-to, from, or to parameters.
For today's integration, we'll focus on the json_output.php endpoint to bring Watmonitor's real-time measurements into ThingsBoard.
By default, ThingsBoard operates as a Push-based platform, meaning it processes data only when it's actively sent to it. However, since ThingsBoard cannot natively perform GET requests, we'll need to adapt its functionality to enable data retrieval (Pull model) instead of relying solely on Push.
Sample Watmonitor JSON data (json_output.php):
{
"name": "Studňa Poprad - záhrada",
"value": 265,
"volume": 1332.04,
"time": "16. Sep 20:25"
}
The first step is to create a new device in the Devices menu. This device can serve purely as a virtual placeholder or be directly linked to telemetry coming from Watmonitor.
In our case, we'll create a device named Studna-Poprad. For now, all we need to do is assign a name—no additional configuration is required at this stage.

1. Custom Widget
ThingsBoard comes with a powerful dashboard system for visualizing telemetry and time-series data. Out of the box, you can choose from a variety of predefined widgets, which can be easily dragged and dropped onto your dashboard. Each widget can then be configured to display the data you want—or in some cases, the widget already comes with its own built-in data logic. Plus, these widgets are fully editable, giving you flexibility to adjust their behavior or appearance.
But what if none of the default widgets fit your needs? That's where custom widgets come in. With them, you can design not only the exact look you want, but also the precise functionality your project requires.
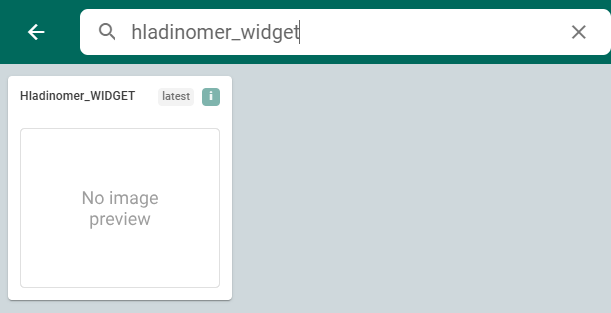
To create one, head to Resources → Widgets Library and select Create new widget. From there, ThingsBoard offers several starting templates, depending on the type of widget you need:
-
Static
-
Latest values
-
Alarm widget
-
Time series
-
Control widget
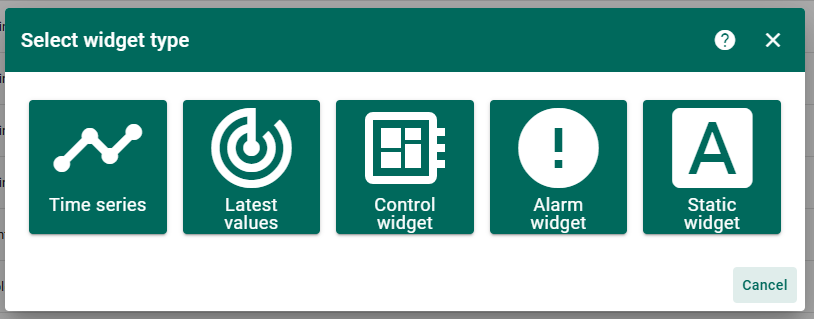
Since we'll be retrieving the latest data from Watmonitor's JSON endpoint (json_output.php), the best option is to select Latest values when creating our widget.
In this widget, we can embed HTML for the structure, apply CSS for styling, and—most importantly—write JavaScript to handle the full functionality. Instead of pulling telemetry directly from ThingsBoard devices, the widget will fetch external data whenever it's loaded, and then automatically refresh every 5 minutes to ensure the dashboard always displays the most up-to-date measurements.
During development, I ran into a common challenge: CORS (Cross-Origin Resource Sharing). Browsers block cross-domain requests by default because of the same-origin policy. This initially caused the widget to load with no data. The interface itself didn't throw a clear error, but by checking DevTools (F12) it became obvious that CORS was the culprit.
The solution was to route the requests through https://corsproxy.io/, a service already used by Watmonitor in its QR scanner and AR scene for HTTPS GET requests. With the proxy in place, the widget could successfully retrieve and display the data.

Once the data is retrieved in JSON format, it's the JavaScript layer that takes care of parsing and displaying it. At the core of this process is the onInit() function.
This function is crucial because it:
-
Immediately triggers the subroutine that fetches and parses the JSON data when the widget is first loaded.
-
Repeats the same process automatically every 5 minutes, ensuring the widget always shows the most recent readings without manual refresh.
With this setup, the widget stays both dynamic and reliable, keeping the dashboard in sync with Watmonitor's live data.
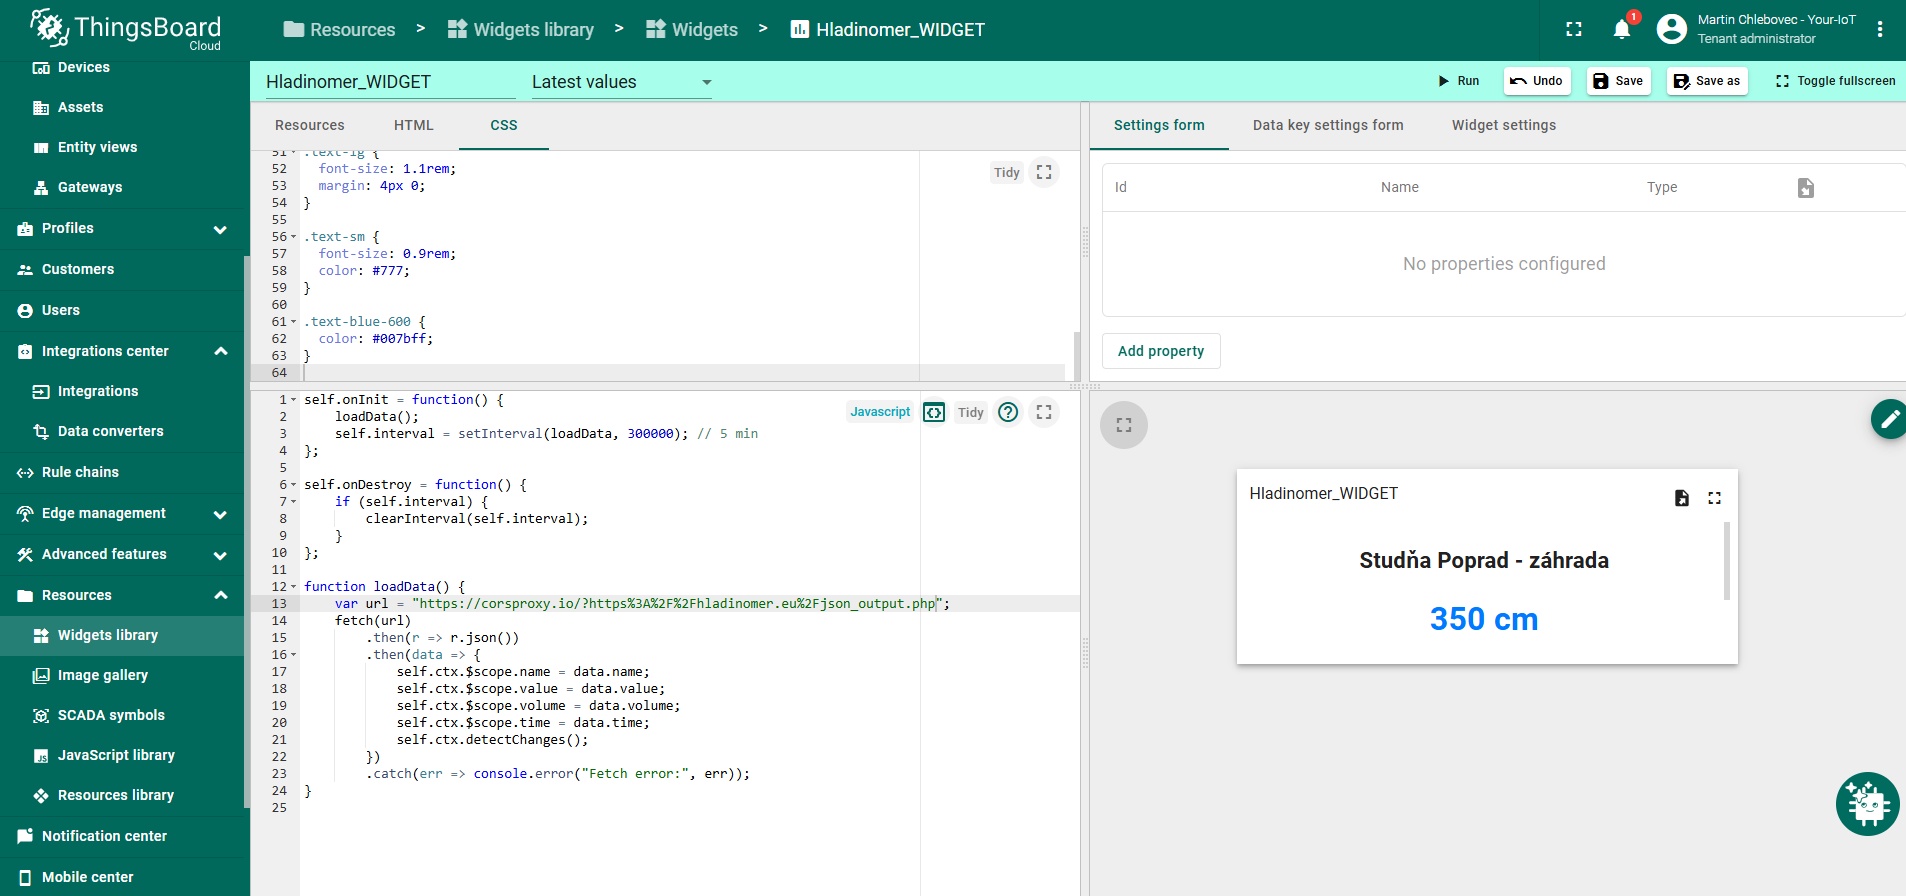
Embedded JS code:
self.onInit = function() {
loadData();
self.interval = setInterval(loadData, 300000); // 5 min
};
self.onDestroy = function() {
if (self.interval) {
clearInterval(self.interval);
}
};
function loadData() {
var url = "https://corsproxy.io/?https%3A%2F%2Fhladinomer.eu%2Fjson_output.php";
fetch(url)
.then(r => r.json())
.then(data => {
self.ctx.$scope.name = data.name;
self.ctx.$scope.value = data.value;
self.ctx.$scope.volume = data.volume;
self.ctx.$scope.time = data.time;
self.ctx.detectChanges();
})
.catch(err => console.error("Fetch error:", err));
}
After finalizing the HTML, CSS, and JavaScript, you end up with a fully functional custom widget that can be saved.
To use it on your dashboard:
-
Open the widget list.
-
Switch the Widgets bundle filter to All widgets to locate your custom creation.
-
Add the widget to your dashboard.
Once added, it immediately begins displaying the live data from Watmonitor, giving you a real-time view of the measurements right on your ThingsBoard dashboard.
Whenever the data changes, the widget automatically performs another GET request—either every 5 minutes or the next time the dashboard is loaded. This ensures the dashboard always reflects the most current measurements from Watmonitor.
This approach isn't limited to ThingsBoard. The same principle—retrieving data from a JSON endpoint—can be applied to almost any IoT platform or industrial system that supports HTTP GET requests and includes a JSON parser or mapper. It's a flexible method for integrating real-time data across a wide range of applications.

2. Rule Chain
The second approach is using a Rule Chain, which, as the name suggests, is a series of rules linked together to achieve a specific outcome. In our case, the goal is to perform a GET request every 5 minutes, parse the retrieved data, and save it as telemetry in ThingsBoard for the target device.
We'll keep it simple and explain each step along the way. First, we create a clean Rule Chain. By default, it contains an Input block, which we won't use or connect to anything.
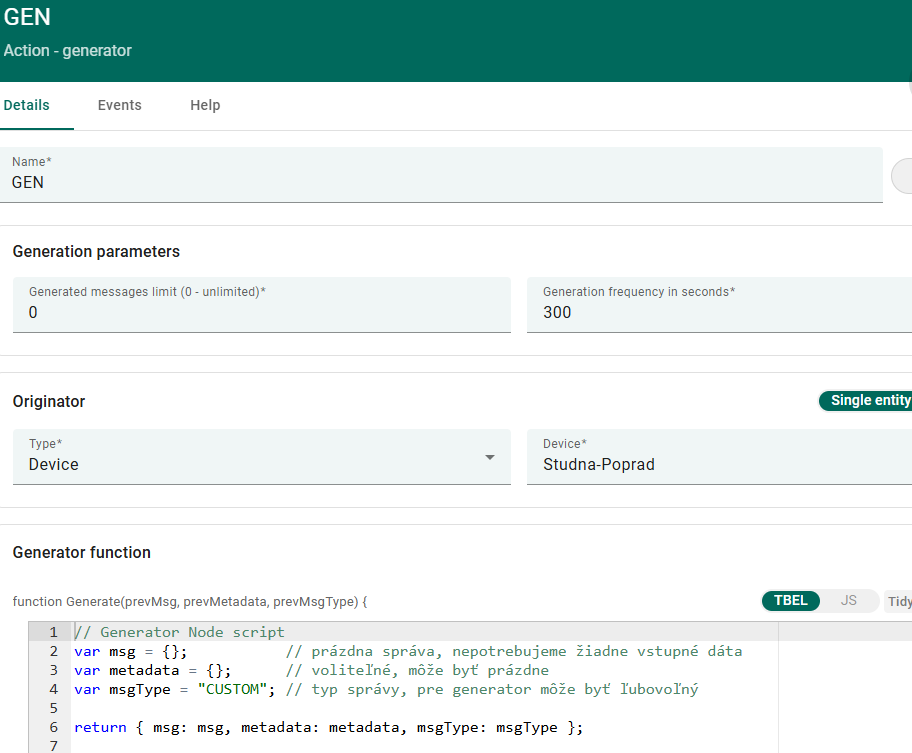
Next, we add a Generator block to the editor. In its properties, we configure:
-
Originator → the device where the telemetry should be saved. At the end of the chain, all processed data will be assigned to this device.
-
Message generation → unlimited messages (set to 0).
-
Interval → every 300 seconds (5 minutes), so the chain automatically triggers the data retrieval and processing at the desired frequency.
The next block in the chain is the REST API CALL, which we connect to the Generator block using the Success label. This ensures that the REST API CALL is triggered whenever a "TICK" occurs—that is, every time the Generator emits a pulse after the specified interval. This setup allows the functionality to run automatically at the defined frequency (the Generator block's minimum interval is 60 seconds).
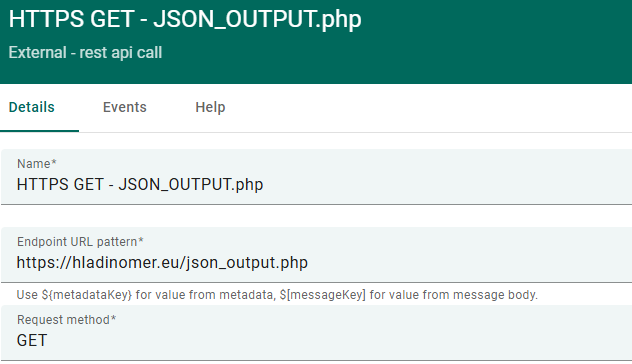
Inside the REST API CALL block, we simply enter:
-
The URL of the Watmonitor JSON endpoint
-
The HTTP method (GET)
There's no need to configure anything else. This block executes the HTTPS GET request and passes along the server's response for further processing. Unlike in the custom widget approach, CORS issues are not a concern here, so there's no need for a proxy or additional workarounds.
Once the JSON response is received, it needs to be parsed so we can extract individual data points, assign them to variables, and ultimately store them in telemetry. To do this, we use a Script block from the Transformation category.
Within the block settings, you can test your JavaScript code against a sample payload. This allows you to simulate the expected JSON from the server and verify whether the transformation works correctly before deploying it. The user's code is embedded inside a Transform function with two parameters, which handles the parsing and mapping of the JSON data.
Finally, the POST_TELEMETRY_REQUEST message type indicates that this block sends a request to write the parsed data as telemetry to the target device, passing it along to the next block in the chain.
Nested JS code:
const value = msg.value;
const volume = msg.volume;
const name = msg.name;
const time = msg.time;
const newTelemetry = {
value: value,
volume: volume,
name: name,
time: time
};
return {
msg: newTelemetry,
metadata: metadata,
msgType: "POST_TELEMETRY_REQUEST"
};
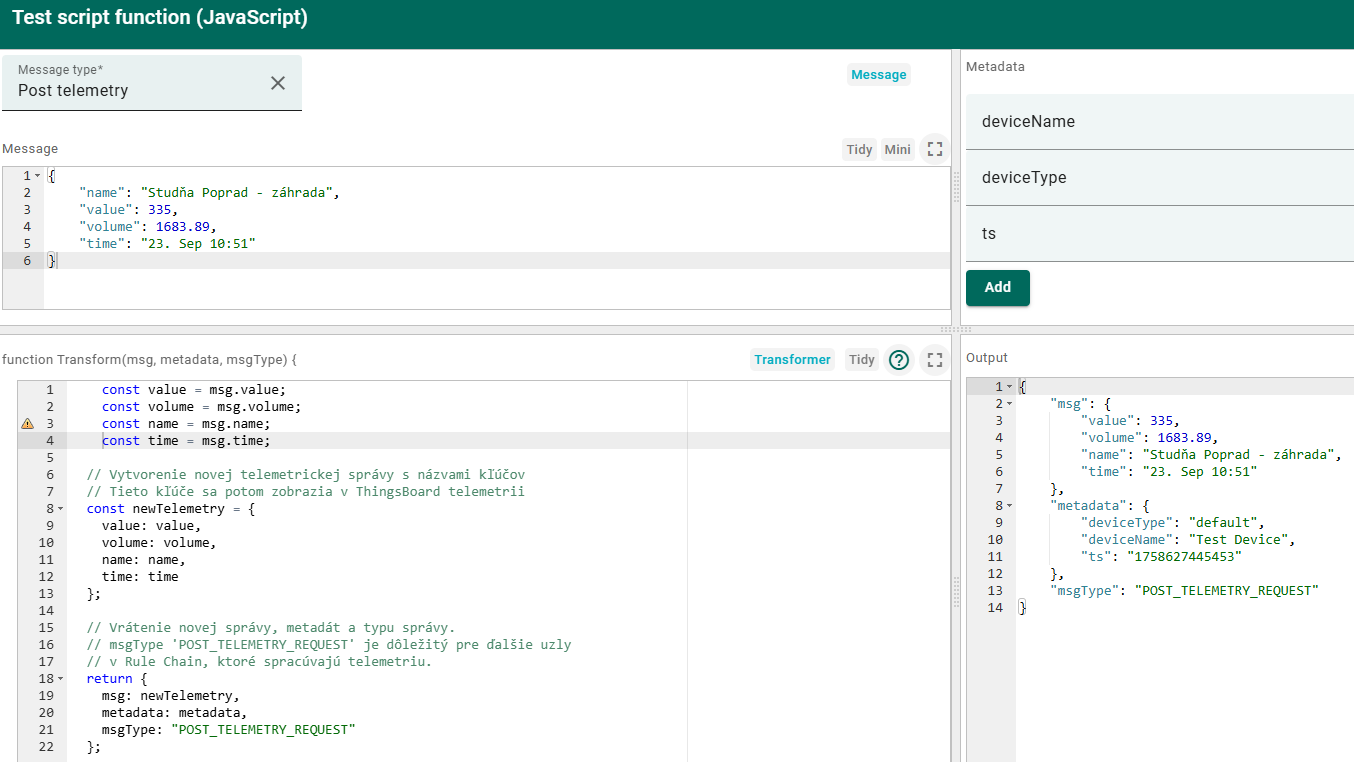
The final block in the chain is the Save Timeseries block. Based on the incoming request and the Originator (the device that triggered the Rule Chain), this block automatically writes the parsed data to the corresponding device's telemetry. No additional configuration is needed—everything is handled automatically.
The complete Rule Chain, showing how the blocks are connected via the Success path, looks like this:

A Rule Chain configured this way—with the Generator at its start—runs independently of whether it's assigned to a device or a Device Profile. It doesn't require the device to actively push data via REST API or MQTT.
In our example, the Studna-Poprad device receives the telemetry, even though it's purely virtual and has never had a real connection. The device essentially acts as an intermediary, storing the telemetry so it can be accessed and visualized on the dashboard, while the actual data retrieval and processing are handled entirely by the Rule Chain.

As we can see, a single dashboard can display two independent visualizations:
-
Left side: A custom widget using JavaScript. This widget pulls data directly from Watmonitor when the dashboard is opened, and then automatically every 5 minutes while the user remains on the dashboard.
-
Right side: Three separate card widgets, each showing telemetry stored under the device. These cards even display the time of the last update, giving a clear indication of when new data is expected.
The right-side data is retrieved automatically via the Rule Chain, triggered by the Generator's tick. This approach is especially advantageous for time-series data, as it allows visualization and graphing based on the actual timestamp from the ThingsBoard server when the data was written. The Rule Chain effectively acts as a CRON job, requesting and storing data at regular intervals without any manual intervention.
In contrast, the custom widget on the left only displays the latest value from the server response. No historical or time-series data is stored, so you only ever see the most recent measurement at the moment of the request.
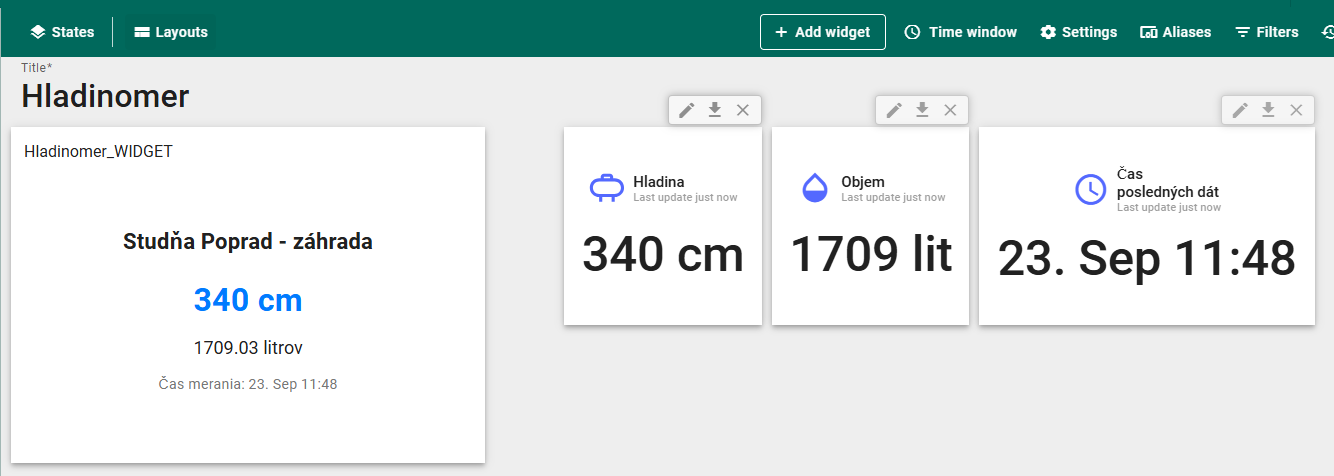
Telemetry recorded through the Rule Chain has the added benefit of being timestamped at the exact moment it's written, ensuring accurate historical data.
Beyond simple data logging, Rule Chains can integrate a wide range of support blocks to extend functionality. You can automate tasks, send notifications, change device states, or trigger complex workflows. ThingsBoard offers blocks for email, SMS, MQTT transmission, AI calls, and even data transfer between other Rule Chains, making it a highly flexible tool for industrial and IoT automation.
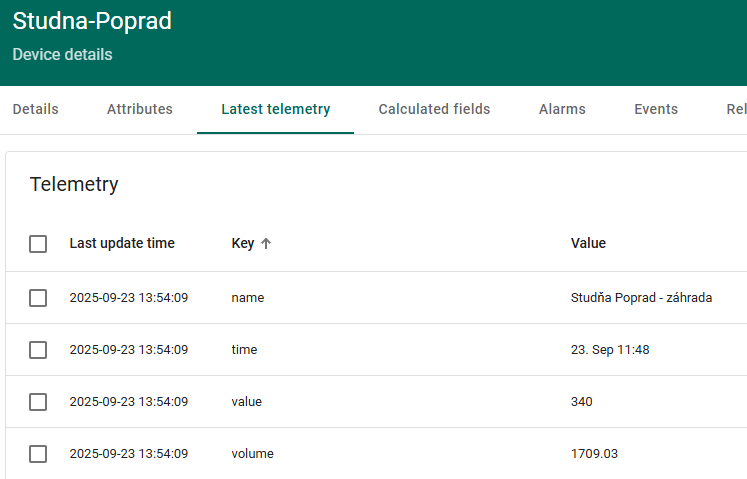
Try Watmonitor with your hardware for free today with Arduino, ESP32, ESP8266, or create custom firmware and connect your hardware to Watmonitor (available also in English, German language):
Exported .json files of the Dashboard, Rule Chain and Widget from ThingsBoard can be found at:
https://github.com/martinius96/hladinomer-studna-scripty/tree/master/examples/Tools_Integrations/ThingsBoard
The device cannot be exported, so you have to create it yourself, or make some changes. If you would like to implement a similar project, either standalone in ThingsBoard, or you would like to connect your ThingsBoard with Watmonitor, contact Your-IoT:
https://your-iot.github.io/portfolio.html
After importing the widget, dashboard, and Rule Chain into a new ThingsBoard instance, you need to perform a few essential setup steps for the specific device:
-
Dashboard setup:
-
Switch the dashboard to Edit mode.
-
Select the widget and click Edit.
-
In Datasources, choose the specific device.
-
This ensures the first widget correctly pulls data from Watmonitor when the dashboard loads and then every 5 minutes.
-
Repeat the same steps for the other three telemetry-based widgets, as they also require linking to a specific device.
-
-
Rule Chain setup:
-
Open the Generator node and select the device in the Originator section.
-
This step is critical because the exported .json configuration uses the device_id to uniquely identify devices in ThingsBoard. While the device name is just a label (and can be duplicated), the ID and token define the actual device.
-
If the device was created under a different account, ThingsBoard cannot automatically link it, leaving the Device field empty, so you must select it manually.
-
-
Customizing the REST API CALL:
-
If you want to pull data directly from your own Watmonitor instance, update the URL in the REST API CALL block of the Rule Chain to point to your json_output.php endpoint.
-
Following these steps ensures that both the widgets and the Rule Chain function correctly in your ThingsBoard instance.
